Can I Calculate Plug Load Savings Without an IGA?
Yes, it’s possible to calculate potential plug load energy savings without performing an investment grade audit. Most energy managers do not have the tools or enough information to confidently estimate potential plug load savings for their buildings. This post will explore different methods to calculate potential savings without performing an investment grade audit.
These estimates will be less accurate than an IGA savings estimate, but they are often sufficient to determine whether it makes sense to proceed with a detailed audit.
Calculate Estimated Plug Load Savings using Rule of Thumb
When specifics about the number and types of loads are unknown, the following rule of thumb can be used to gauge potential energy savings:
The yearly cost to power an uncontrolled kW load is roughly $1,000. Powering the load off nights and weekends saves nearly $700 each year since commercial buildings are only occupied about 30 percent of the time.
Here’s the math:
Annual Cost Uncontrolled kW MEL at $.11 kWh
Devices are on all day, every day8,760 hours on x $.11 kWh rate = $ 963.60
Annual Savings Controlled kW MEL at $.11 kWh
Devices turned on weekdays, turned off nights and weekends6,132 hours off x $.11 kWh rate = $ 674.52
Use Automated Plug Load Energy Savings Calculator
A more accurate and detailed plug load energy savings estimate can be created with an automated savings calculator like Bert’s Preliminary Savings Sheet (PSS). The PSS estimates the number of common plug loads for each building based on the type of building and its size. It also includes potential kWh and dollar savings for the project by device type and building.
Bert uses exclusive data about the number of devices per square foot and average hourly standby loads from earlier projects to estimate savings. The following data is needed for Bert’s model: building types, square footages and kWh rates.
Contact Bert for a Preliminary Savings estimate.
Audit Buildings For Most Accurate Plug Load Energy Savings Calculations
A detailed physical inventory is the most accurate way to estimate savings. Without this level of detail, it is simply not possible to accurately calculate plug load energy savings.
Record the location, quantity and device type of all plug loads electronically. This makes the savings estimate more accurate. In addition, ESCOs, installation partners, and the end user can all easily access the data. At the same time, determine the standby load for each device type. Run the IGA saving model using actual audit counts and standby loads.
Compare Measured Overnight Load to Savings Estimate to Verify Energy Savings
Once control and measurement devices, such as the Bert Smart Plug and Inline Series, are installed the savings model should be run again using the ‘as-built” quantities and measured standby loads. Compare KWh and dollar savings to the earlier savings estimates.
Calculate the Reduction in Baseline Load Percentage
Finally, compare the proportion of the Overnight Load to the Baseline Load to calculate the energy savings as a percentage of the total Baseline Load. In most projects, Overnight Load represents somewhere between 30% and 50% of the Baseline Load.

This percentage varies greatly between projects, depending on occupancy hours, kinds of devices controlled and the daytime energy usage patterns. In buildings with heavy daytime device usage, the daytime load represents a larger proportion of the overall load, so reduction in baseline load will be closer to 30%. In buildings where devices are used less frequently during the week, the daytime and overnight loads will be closer in size. In these cases, baseline load reduction could be close to 50 percent.
As you look at the percentage, keep in mind that the percentage reduction is not directly related to the project’s kWh or dollar savings. A lower percentage does not mean that a project is saving less money or fewer kilowatt hours than a project with a higher percentage. It just means that, on a relative basis, the projects with the smaller reduction percentage has larger daytime loads.
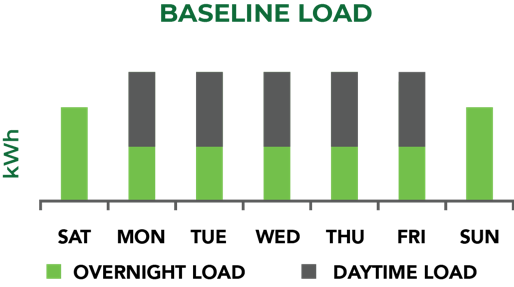
Breakdown of the Baseline Load
Baseline Load: kWh recorded during baseline data collection
Includes all devices and circuits that will be controlled. Devices operate without schedules, collecting hourly measurement data. Baseline Load is split into two categories for savings calculations: Daytime Load and Overnight Load.
Daytime Load: kWh while the building is occupied
This load varies from week-to-week and can differ from the load recorded during baseline data collection. Devices are scheduled on.
Building operators seeking detailed information about daytime device usage should use an administrative dashboard like Bert Analysis to analyze and compare daytime energy usage.
Overnight Load: kWh while the building is empty
Also called Standby Load. This load is eliminated once devices are scheduled. Total kWh savings and dollars are equal to the size of this load.