Are portable air purifiers part of your building’s reopening plan? If so, you may want to consider adding Bert’s Plug Load Control solution to your air scrubbers. Bert saves money by automatically turning units off nights and weekends and restarting them in the morning before rooms are occupied. This reduces each purifier’s annual electrical expense by roughly 60%.
How Do Air Purifiers Help Buildings Reopen?
Portable HEPA filtration systems are also called air scrubbers. Units draw in air from the surrounding environment, use filters to remove contaminant particles, and recirculate filtered air. They can be an integral part of a multi-layered strategy to keep school buildings safe.
The Harvard T.H. Chan School of Public Health Healthy Buildings Team recommends that indoor rooms meet at least one of two air ventilation targets through a combination of fresh outdoor air, recirculated air filtered at MERV 13 level or higher (for rooms with mechanical ventilation), and the use of portable air cleaners with HEPA filters:
- At least 5.0 air changes per hour (ACH) of clean air—with the Healthy Buildings Team defining 4-5 ACH as “good,” 5-6 ACH as “excellent”, and 6+ ACH as “ideal”
- At least 15 liters per second per occupant of clean air, lowering the population density of rooms that cannot fully meet the ACH-based target as a complimentary ventilation strategy
To help building operators determine whether air scrubbers are needed, the Healthy Buildings team created a simple calculator. Enter variables such as room square footage, ceiling height, outdoor ventilation level, and air purifier capacity. The tool indicates whether the room meets the ACH target with the proposed air scrubber.
How Much Do Air Scrubbers Cost to Operate?
Portable air purifiers are not connected to HVAC systems. They run 24/7 unless someone physically turns the unit off. Annual costs to operate a scrubber vary based on kWh rate, operating wattage, and operating hours. Annual Energy cost ranges from $92 for lower-end 400 CFM units ( $.11 kWh) to $ 2,170 for high-end commercial 1,500 CFM units ($.18 kWh). To determine potential energy savings for scrubbers in your building, use the Air Purifier Energy Savings Calculator shown below.
Enter the wattage, kWh rate and select the number of ON hours. Annual electrical expenses with and without Bert are calculated, along with the annual $ savings.
How Does Bert Control My Air Scrubbers?
Installation is easy. Each air scrubber is plugged into a Bert Smart Plug, which is plugged into an existing wall outlet. The Bert uses the existing wireless network to check for schedule updates and to send real-time measurement data from the air scrubber. Berts are scheduled and grouped by HVAC zone, building, building group, or other user-specific group. Administrators can view the relay state and communication status for each unit.
Every Bert stores its schedule locally. As a result, Berts will continue to turn air scrubbers on and off even if the wireless network is down. Berts also have an override button that allows individual users to turn air scrubbers on manually if needed.
Frequently installed as a standalone solution, Bert delivers even greater value when integrated into BACnet/IP building automation systems or web-based applications because air scrubbers can be managed in context with the other building loads. For example, occupancy sensors can trigger the BAS to turn air purifiers on.
Bert does more than controlling air purifiers. Bert’s Plug Load Control solution monitors and controls other plug and hardwired building loads, including electric hot water heaters, air handling units, exhaust fans, AC units, vending machines and other electronic devices in over 10,000 buildings. Bert controls loads ranging from individual 120V/15A loads to 277V/20A, at either the device or circuit level. In most cases, the annual payback to install Bert is less than one year.
Contact Bert to learn more about controlling air purifiers.
Plug load management helps commercial buildings achieve energy reduction goals.
Plug load management lowers whole commercial building energy consumption by 10%, according to the National Renewable Energy Laboratory (NREL). Viewed individually – plug and process loads seem small and inconsequential to many. Yet plug loads represent the largest electrical end use in many buildings. The annual savings potential for US plug loads is approximately 1.6 Quads, which is equivalent to the energy usage of 16 million US households.
In the future, plug loads will represent an even larger percentage of whole-building energy usage. The percentage of whole-building energy attributed to PPLs is expected to increase from 40% to 49% by 2040, according to the DOE’s Office of Energy Efficiency & Renewable Energy (EERE). In contrast, HVAC and other major end uses will decrease during the same time period according to the projections.
Despite the large potential for energy savings – up to 40% per device – plug loads are not typically monitored or controlled, even in buildings controlling other end uses. This is unfortunate because plug load management solutions install quickly and deliver immediate energy savings.
What is Plug Load?
Let’s start by defining “plug load.” Traditionally, plug load refers to devices that are plugged into 120V/15A outlets. Common loads include printers, copiers, TVs, coffee makers, charging carts, vending machines, TVs, beverage dispensers and projectors. At Bert, we also offer control and metering solutions for larger inline loads such as window AC and PTAC units, hot water heaters, commercial refrigeration, exhaust fans and air handing units.
Why Do Plug Loads Use So Much Energy?
It is hard to imagine that small loads can have such a big impact on the building’s energy consumption. There are two reasons plug loads represent such a large portion of a building’s base load. First, plug loads are ”vampire devices,” meaning they consume energy – even when no one is using them. In fact, many plug loads consume almost as much energy nights and weekends as they do during daytime working hours. Second, loads like window AC and PTAC frequently run all night long.
How Does Plug Load Management Save Money?
Commercial buildngs are empty almost 75% of the time. Plug load management solutions monitor and control plug load energy usage, continuously recording energy usage and automatically turning loads off while buildings are empty. Devices are turned off nights and weekends, eliminating overnight standby loads. Paybacks vary depending on the device controlled, but typically range from less 12 months to 5 years.
How Does Plug Load Management Work?
Plug load management solutions use a combination of “smart” outlets, software and integration tools to manage devices and collect building data. Smart plugs and inline hardware collect data from connected devices and transmit it over the existing 802.11 Wi-Fi network for measurement, tracking and control purposes. All Bert hardware is intelligent and IoT-ready. Bert controls loads ranging from 120V/15A devices to 277V/20A circuits.
Bert integrates plug load systems into existing energy management systems whenever possible. Bert works with BACnet/IP building automation systems as well as web-based analytics and energy management systems.
Does Plug Load Control Make Sense for You?
Let Bert do the math for you. We enter your building types, sizes and kWh rates into our proprietary modeling tool. The tool calculates the expected number and types of plug and inline devices by building. Using the occupancy hours for each building, Bert estimates energy savings using standby load data from previous projects.
Implementing plug load control works best with an experienced partner. Even though plug load energy savings is considered low hanging fruit, it represents a small piece of many performance contracts. Therefore, ESCOs must be confident about their partners’ ability to quickly and efficiently deliver maximum energy savings before adding plug load control to a project.
At Bert, we know what we’re doing. We created a structured installation process, designed for performance contracts, that has been refined after installing 40,000 Berts in 1,000 buildings. We complete most projects within 6 – 8 weeks, keeping partners and users updated every step along the way. This post highlights our approach to implementing plug load control.
Turnkey Plug Load Implementations Ensure Success
It’s a fact. ESCOs don’t have the time or energy to manage plug load projects. Instead they rely on partners with the resources and expertise to manage the entire implementation for them. ESCOs require turnkey solutions from vendors with the capability to handle everything, including audits, installations and integration services.
At Bert, we see ourselves as more than just a technology company. We take complete responsibility for the entire project, from preliminary savings through measurement and verification. In some projects, Bert performs the IGA audit and the hardware installation. Other times, we train and manage partners selected by the ESCO. Either way, we do not turn the system over until every Bert is named, grouped and scheduled and the post-installation savings report is created.
Details Matter When Implementing Plug Load
Projects require attention to details. Besides documenting the location and type of each load, it’s also necessary to identify locations that lack Wi-Fi coverage or have other issues preventing the installation of plug load control hardware. Ideally, this data is shared with partners and end users throughout the project. For instance, installers need the audit data before going on-site so they know where to go. Performance contractors and end users want “as-built” documents reflecting up-to-the minute progress.
Cloud-based tools make it possible to keep track of the specifics. In addition, information such as photos of hardwired inline devices can be shared real-time. Bert’s set of robust iOS and Android audit and installation tools facilitates data sharing. Besides providing instant access to the data, the technology allows Bert to remotely monitor audits and installations, providing immediate assistance.
Provide easy-to-understand energy savings estimates
Everyone agrees the goal is delivering actual energy savings that are equal to the IGA savings estimate. In a perfect world, IGA estimates would be identical to the post-installation savings reports. In reality, most projects have minor equipment changes. Therefore, ESCOs and user must be able to easily compare the IGA and the final “as-built”.
Bert makes it easy by presenting all savings data in the same format. Whether it’s a Preliminary Savings estimate, an IGA estimate, or a post-installation M&V report, the data looks the same.
To ensure the actual savings are equal to our IGA estimate, we deliberately generate conservative IGA estimates and continue to identify additional energy savings opportunities throughout the life of the project. We are proud of our ability to consistently achieve actual energy savings that exceeds our IGA estimate in many projects.
Decide upfront if projects warrant an IGA
It’s true that implementing plug load control improves most project economics, but not all projects make sense – particularly in locations with extremely low kWh rates or in buildings where devices need to be on all day, every day. ESCOs often prefer to do an upfront analysis before deciding whether or not to proceed with an IGA.
Bert’s Preliminary Savings Sheet provides ESCOs with an educated guess about potential energy savings without going on-site. We enter the building types, building sizes and building kWh rates into a proprietary modelling tool that calculates the expected number and types of plug and inline devices by building. Based on the occupancy hours for each building, the tool estimates energy savings using standby load data from similar devices in previous Bert projects.
Assuming the numbers make sense and the project moves forward, Bert follows up with an on-site IGA. Estimated counts are replaced with actual counts and savings are recalculated.
If you want additional information about implementing plug load control, please feel free to reference our FAQ guide or reach out to a Bert representative.
Yes, it’s possible to calculate potential plug load energy savings without performing an investment grade audit. Most energy managers do not have the tools or enough information to confidently estimate potential plug load savings for their buildings. This post will explore different methods to calculate potential savings without performing an investment grade audit.
These estimates will be less accurate than an IGA savings estimate, but they are often sufficient to determine whether it makes sense to proceed with a detailed audit.
Calculate Estimated Plug Load Savings using Rule of Thumb
When specifics about the number and types of loads are unknown, the following rule of thumb can be used to gauge potential energy savings:
The yearly cost to power an uncontrolled kW load is roughly $1,000. Powering the load off nights and weekends saves nearly $700 each year since commercial buildings are only occupied about 30 percent of the time.
Here’s the math:
Annual Cost Uncontrolled kW MEL at $.11 kWh
Devices are on all day, every day8,760 hours on x $.11 kWh rate = $ 963.60
Annual Savings Controlled kW MEL at $.11 kWh
Devices turned on weekdays, turned off nights and weekends6,132 hours off x $.11 kWh rate = $ 674.52
Use Automated Plug Load Energy Savings Calculator
A more accurate and detailed plug load energy savings estimate can be created with an automated savings calculator like Bert’s Preliminary Savings Sheet (PSS). The PSS estimates the number of common plug loads for each building based on the type of building and its size. It also includes potential kWh and dollar savings for the project by device type and building.
Bert uses exclusive data about the number of devices per square foot and average hourly standby loads from earlier projects to estimate savings. The following data is needed for Bert’s model: building types, square footages and kWh rates.
Contact Bert for a Preliminary Savings estimate.
Audit Buildings For Most Accurate Plug Load Energy Savings Calculations
A detailed physical inventory is the most accurate way to estimate savings. Without this level of detail, it is simply not possible to accurately calculate plug load energy savings.
Record the location, quantity and device type of all plug loads electronically. This makes the savings estimate more accurate. In addition, ESCOs, installation partners, and the end user can all easily access the data. At the same time, determine the standby load for each device type. Run the IGA saving model using actual audit counts and standby loads.
Compare Measured Overnight Load to Savings Estimate to Verify Energy Savings
Once control and measurement devices, such as the Bert Smart Plug and Inline Series, are installed the savings model should be run again using the ‘as-built” quantities and measured standby loads. Compare KWh and dollar savings to the earlier savings estimates.
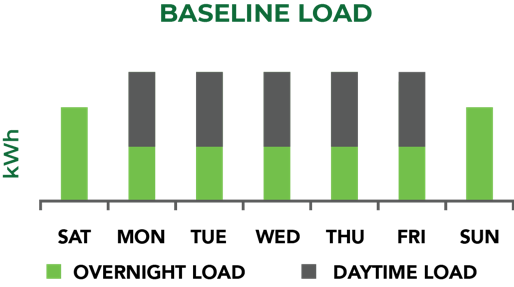
Calculate the Reduction in Baseline Load Percentage
Finally, compare the proportion of the Overnight Load to the Baseline Load to calculate the energy savings as a percentage of the total Baseline Load. In most projects, Overnight Load represents somewhere between 30% and 50% of the Baseline Load.

This percentage varies greatly between projects, depending on occupancy hours, kinds of devices controlled and the daytime energy usage patterns. In buildings with heavy daytime device usage, the daytime load represents a larger proportion of the overall load, so reduction in baseline load will be closer to 30%. In buildings where devices are used less frequently during the week, the daytime and overnight loads will be closer in size. In these cases, baseline load reduction could be close to 50 percent.
As you look at the percentage, keep in mind that the percentage reduction is not directly related to the project’s kWh or dollar savings. A lower percentage does not mean that a project is saving less money or fewer kilowatt hours than a project with a higher percentage. It just means that, on a relative basis, the projects with the smaller reduction percentage has larger daytime loads.
Breakdown of the Baseline Load
Baseline Load: kWh recorded during baseline data collection
Includes all devices and circuits that will be controlled. Devices operate without schedules, collecting hourly measurement data. Baseline Load is split into two categories for savings calculations: Daytime Load and Overnight Load.
Daytime Load: kWh while the building is occupied
This load varies from week-to-week and can differ from the load recorded during baseline data collection. Devices are scheduled on.
Building operators seeking detailed information about daytime device usage should use an administrative dashboard like Bert Analysis to analyze and compare daytime energy usage.
Overnight Load: kWh while the building is empty
Also called Standby Load. This load is eliminated once devices are scheduled. Total kWh savings and dollars are equal to the size of this load.